Schematic Overview of the SIO Ecosystem by Laura Spillner
This project's output is the demonstration of a proactive intelligent observatory and analysis tools for social inequality. The observatory is based on both big data from historical archives as well as big data extracted from social media.
This interactive support tools for capturing and understanding narratives in socioe-conomic history research may be of use for researchers but also for policy makers. It allows the analysis and mapping of the public perception of social phenomena, highlighting correlations of interest. Moreover, it is helpful in tracing the large datasets created by social media.
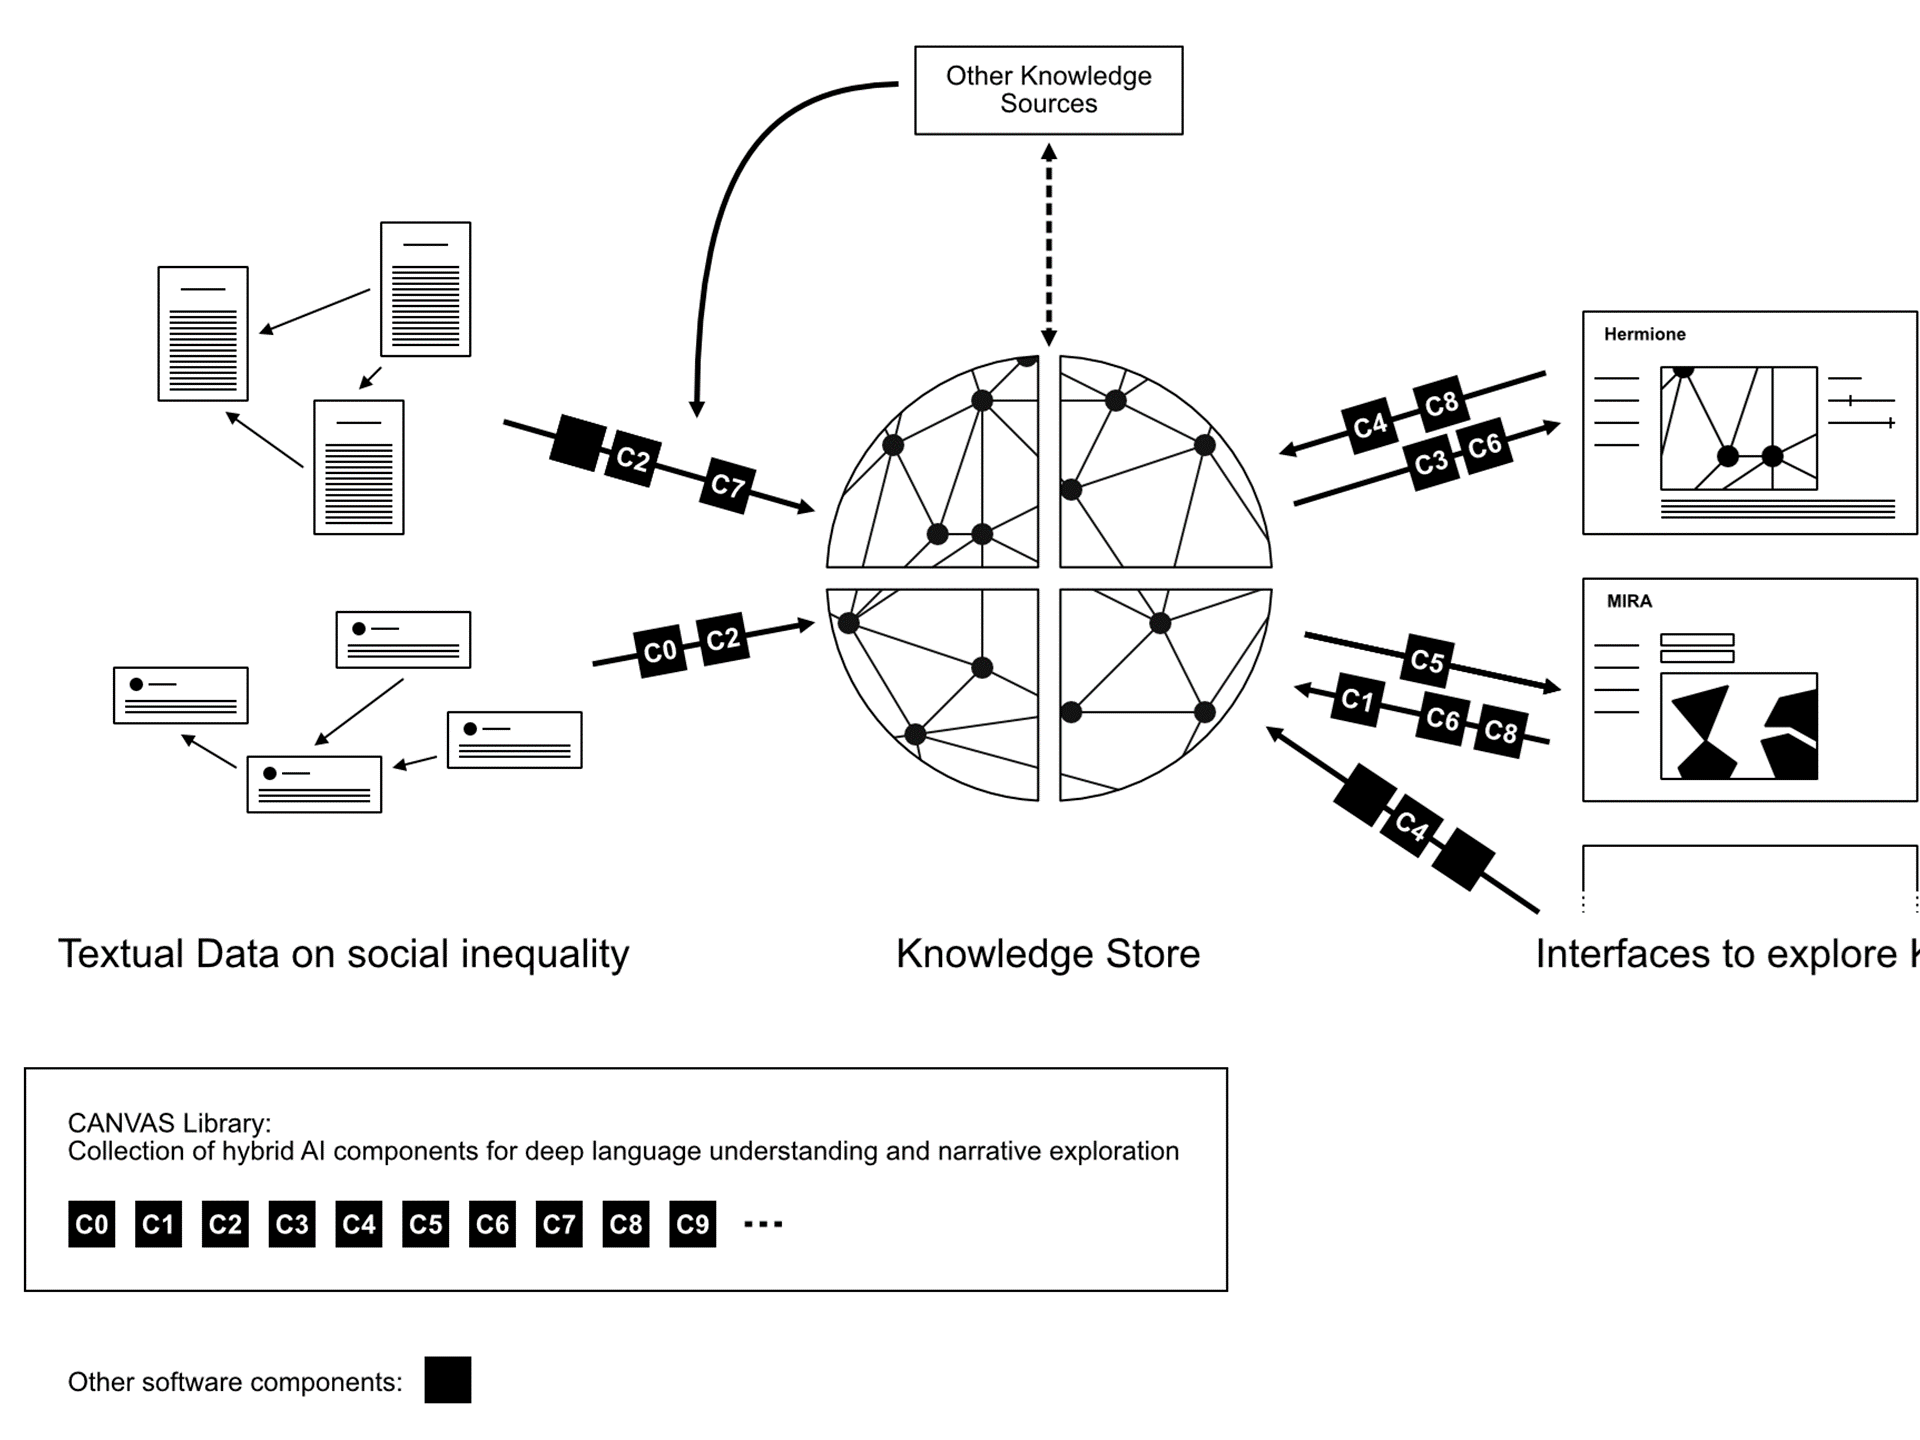
The Social Inequality Observatory (SIO) was developed into an ecosystem of interconnected parts:
• knowledge stores of social inequality narratives retrieved from various textual datasets, for instance paper abstracts and tweet texts;
• an hybrid AI components for language understanding, narrative construction, analysis and contextualization as well as visualization of the results;
• different interfaces that users can interact with to explore different parts of the social inequality discourse (mainly scholarly and societal debate) and investigate the inequality narratives within them.
What are the three main assets that can be explored:
♦ Knowledge Store: The knowledge contained in the textual datasets is processed using a number of symbolic and statistical AI components, both existing ones and ones developed in the course of the MUHAI project.
♦ HERMIONE: an interactive dashboard, we aim to bring greater visibility to these issues by providing a platform for exploring and understanding, in a user-friendly and visually appealing way, the perceptions of inequality in our society.
♦ MIRA: which allows users to (i) turn research questions or paper abstracts into structured and interlinked data, (ii) explore pathways between research question variables to better understand social phenomena, (iii) plot geographical or temporal trends on maps, (iv) or explore the MIRA knowledge graph using HERMIONE’s co-occurrence network or fine-grained view.
Users will be able to develop additional interfaces by querying our knowledge graphs, by developing their own methods or by integrating the AI components published by the MUHAI project. All three parts are based on the MUHAI AI components, which will be published in one library as part of the CANVAS deliverable in the final project stage.
The MUHAI consortium (in particular the Sony Computer Science Laboratories-Paris, the VUA, the UHB and the VIU) are involved in this research process.
Are you ready to visit the observatory?